
How we got here.
Predicting the future (of waves) is hard. Surfline has spent more than 35 years trying to figure it out. We don't expect to be perfect, but we've put more time and effort than anyone else into trying to forecast waves as accurately as possible, while continually measuring how well we're doing, so we can keep improving.
The science behind surf forecasting is a complex process that involves a lot more than the forecast team looking at a crystal ball. In short: swell models are a computer-generated forecast calculated from data collected in the ocean and atmosphere.
Over the years, we’ve developed custom, surf-specific models to predict surf and provide our forecasters with a foundation for their outlooks and reports.
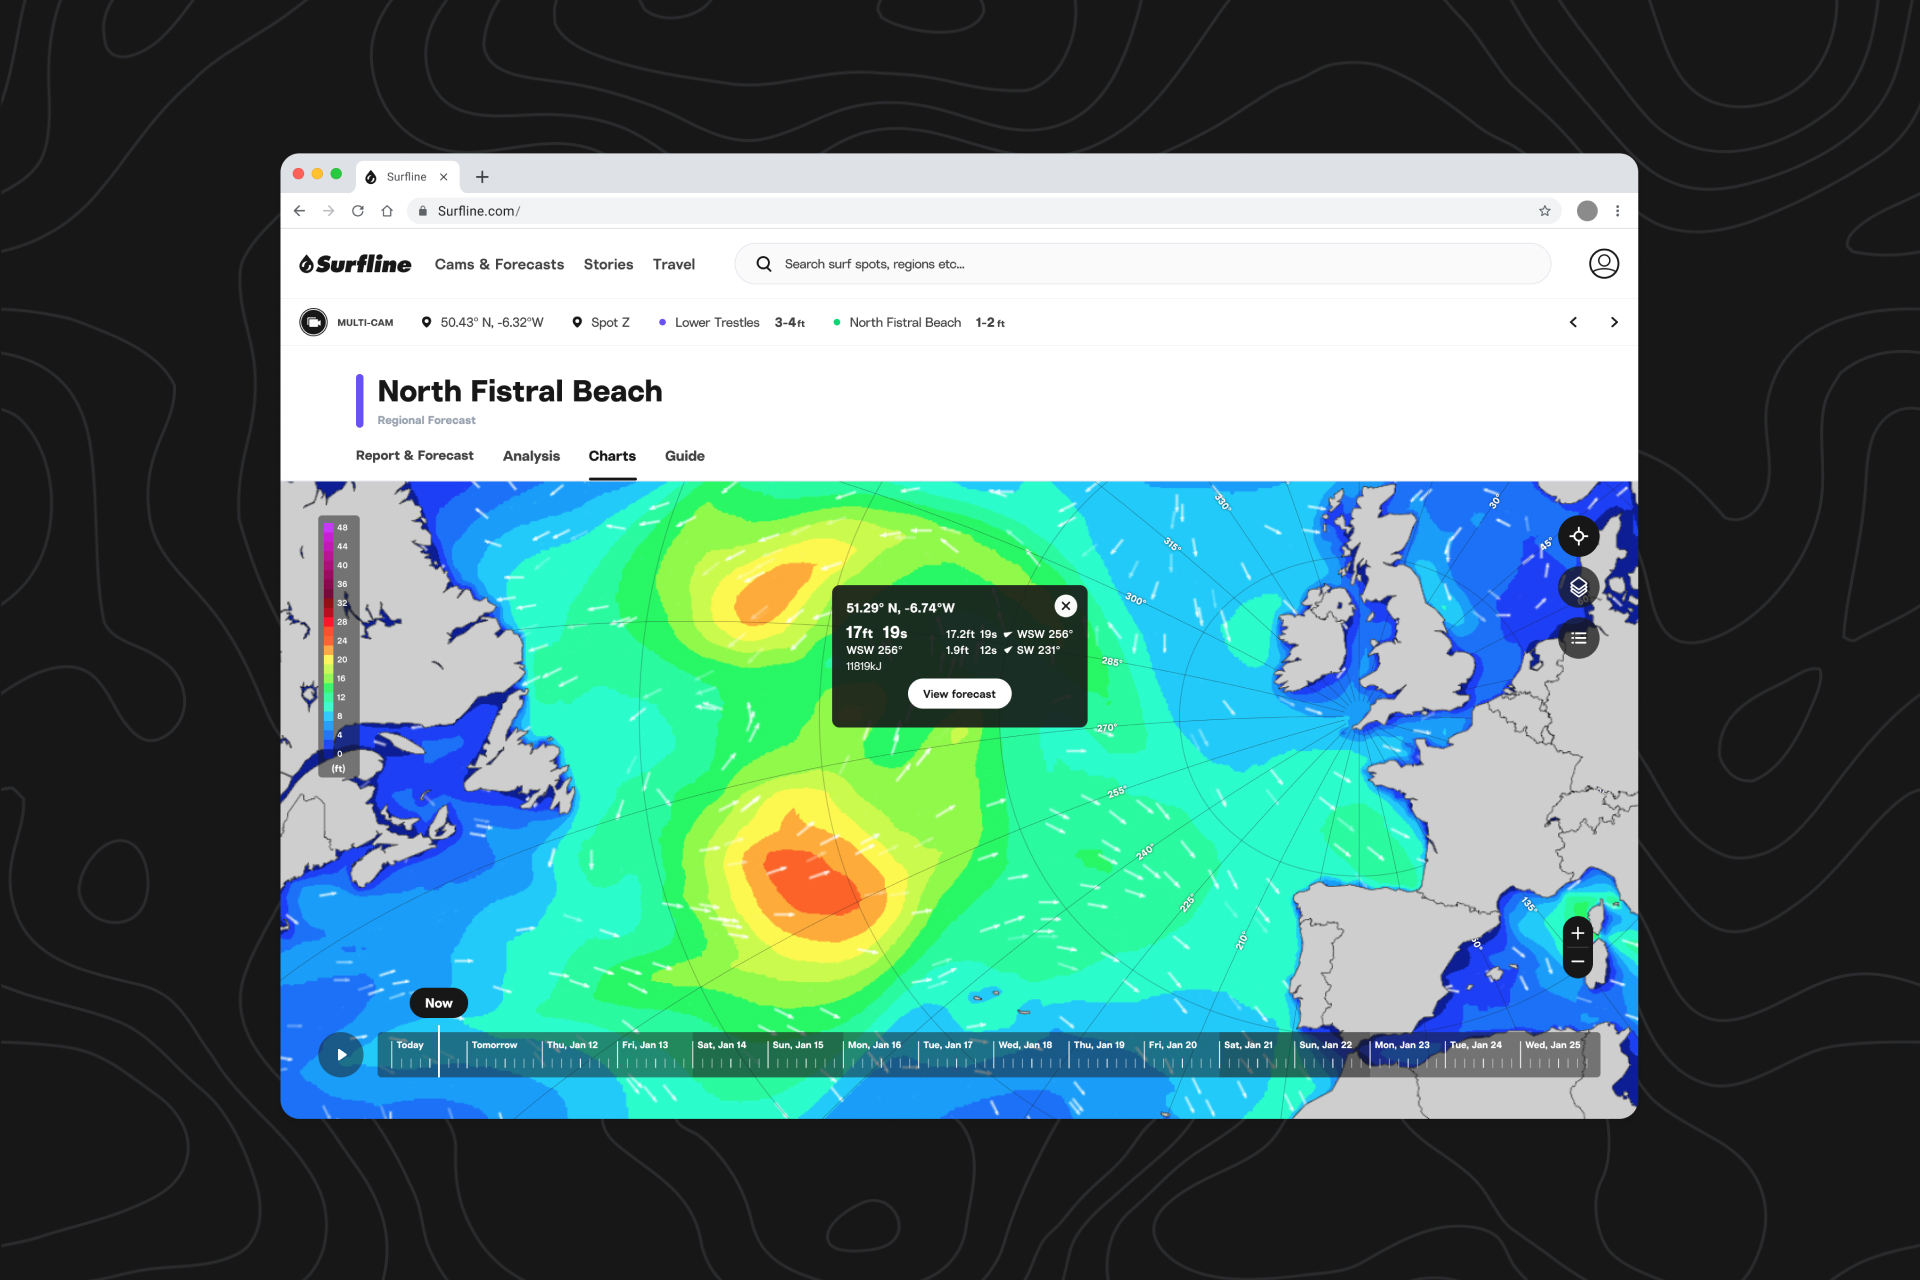
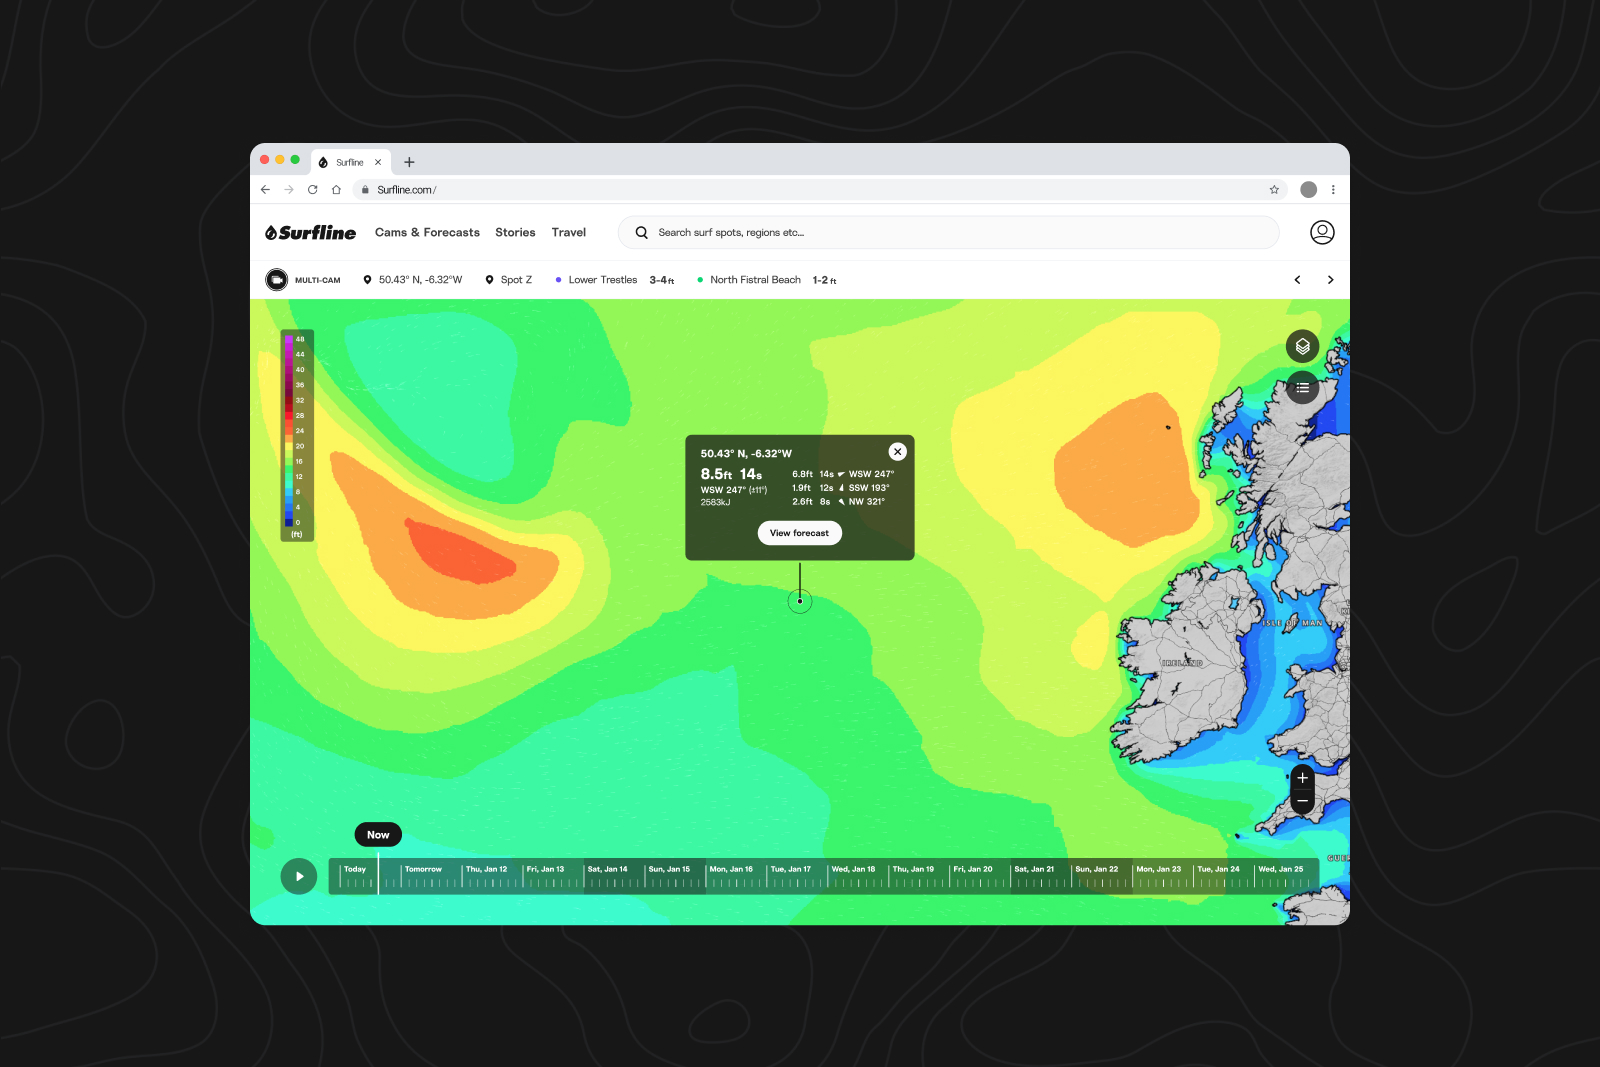
In 2001, Surfline founder Sean Collins and the Surfline team created LOLA, a first-of-its-kind swell model that combined satellite data with bathymetry (underwater mapping) and nearshore buoy data to produce a user-friendly surf forecast, updated every six hours.
What is LOTUS?
In recent years, we’ve enhanced our forecasting capabilities by building on the foundation of LOLA and introducing LOTUS—which incorporates new tech, like machine learning, to provide even better local results, at an hourly rate.
LOTUS is a forecast system created by our in-house team that blends high-res bathymetry mapping and near-shore wave models, and performs billions of calculations an hour to predict how wind will make waves and how the waves will evolve.
What makes LOTUS different from other marine forecast models?
- It’s specifically configured for surf: most forecast models you’ll see are configured for deep water swell. Our nearshore models actually take deep water data all the way to the beach, so we can make the call for surf height where the waves are actually breaking.
- It incorporates a treasure trove of data: LOTUS takes in 25 years of our historical surf reports and 20 years of camera stream data, and combines this data with satellite assimilation, high-resolution bathymetry mapping, and forecaster input to validate and train it.
- It learns and improves with observational data: Other models don’t incorporate observational data. This means that a model that makes a prediction ten days out shows that same prediction ten days later, even if the original storm was incorrectly predicted. We input observations from multiple sources, including our own forecast team, camera data, and feedback from you, combined with machine learning to update model resolution.
- It’s supported by a dedicated team that validates and calibrates the model for more than 5000 spots around the world: Our in-house team of forecasters and data scientists validate the model at breaks around the world using satellites and buoys as the model runs and swells get closer to the coast, so the forecast is always up-to-date.
Like all surfers, we care (a lot) about how accurate the forecast is at our own homebreaks.
How we improve LOTUS at the spot level.
Let’s look at how we’d adjust the model for a spot, using Del Mar as an example.
Step 1: collect data
We collect observational data for the spot, including forecaster reports, surfer-submitted forecast feedback, and camera-driven info. We’ll also incorporate the latest bathymetry data and run a 25-year hindcast with the latest settings for a spot. The long hindcast gives us the best foot forward for the spot analysis and calibration.
Using this, we can gather some relevant dates:
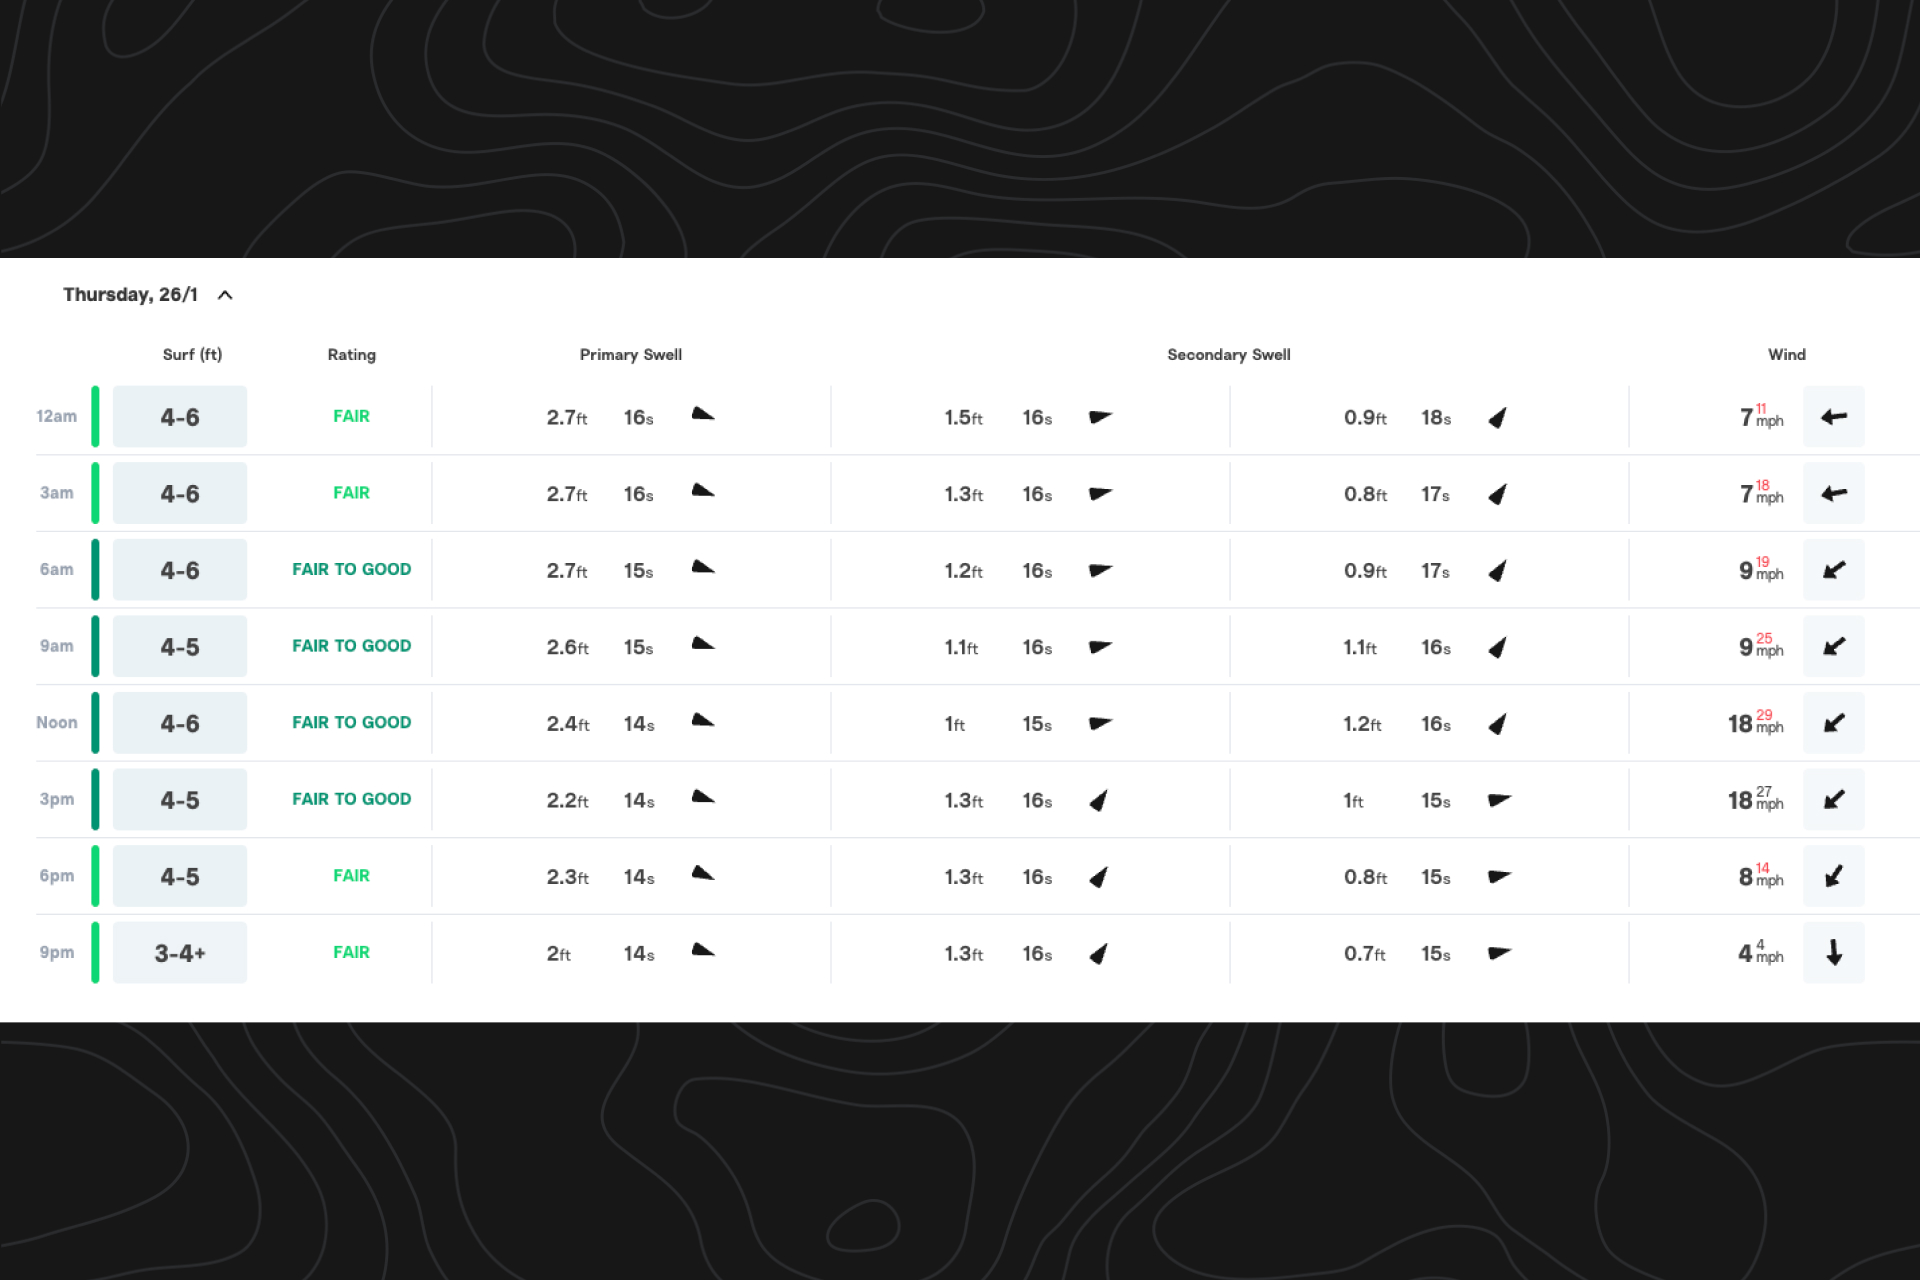
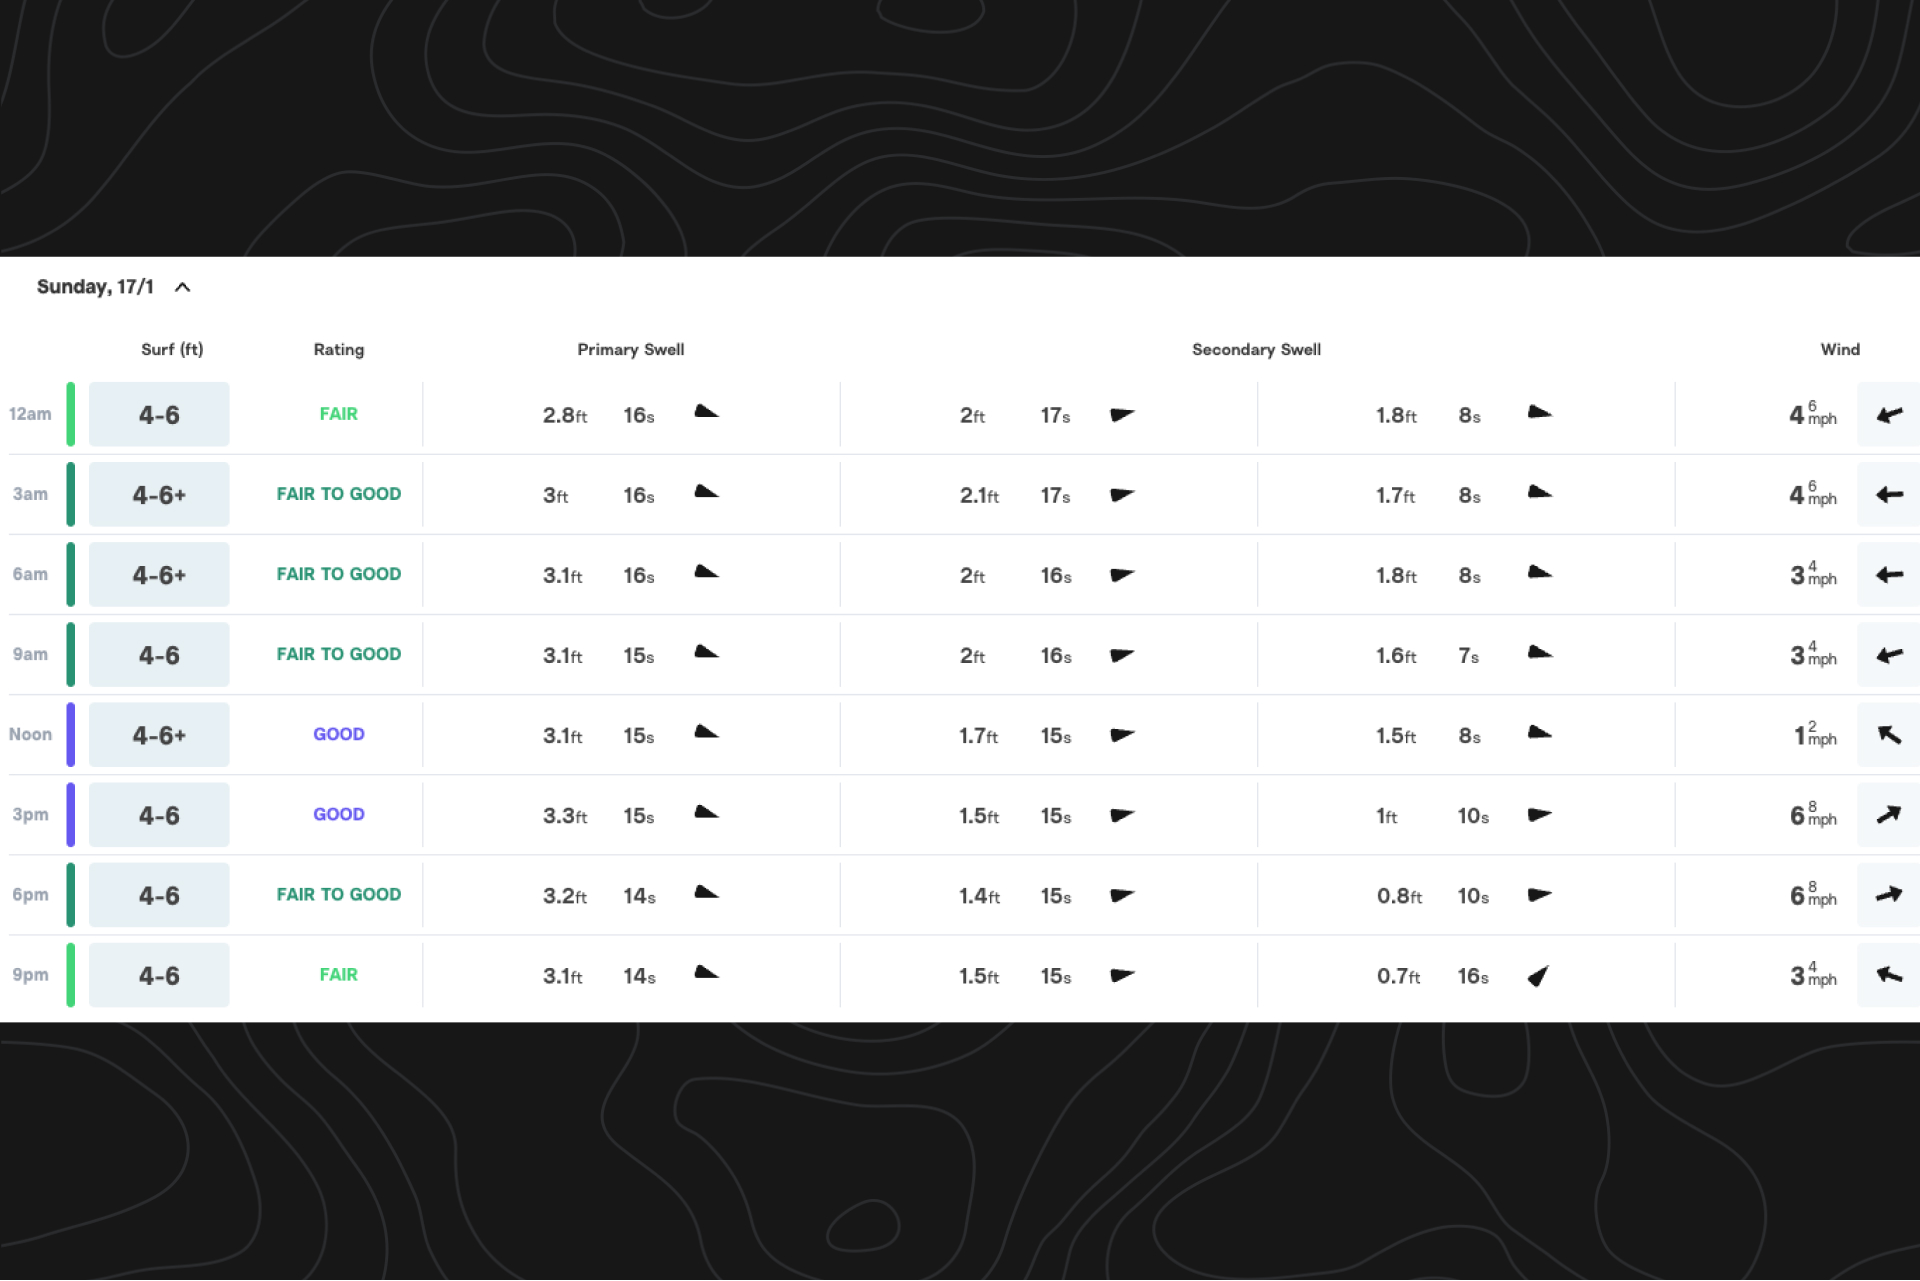
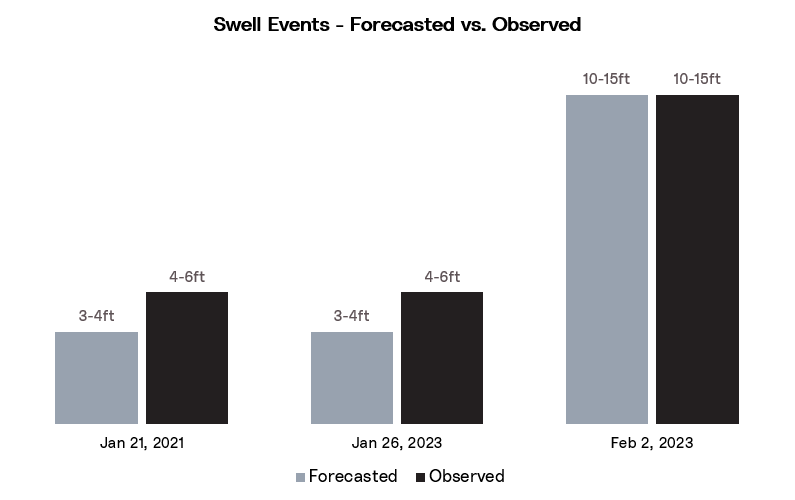
Del Mar conditions were reportedly “Good” on January 21st, 2021, so we want to check if the model accurately called this day.
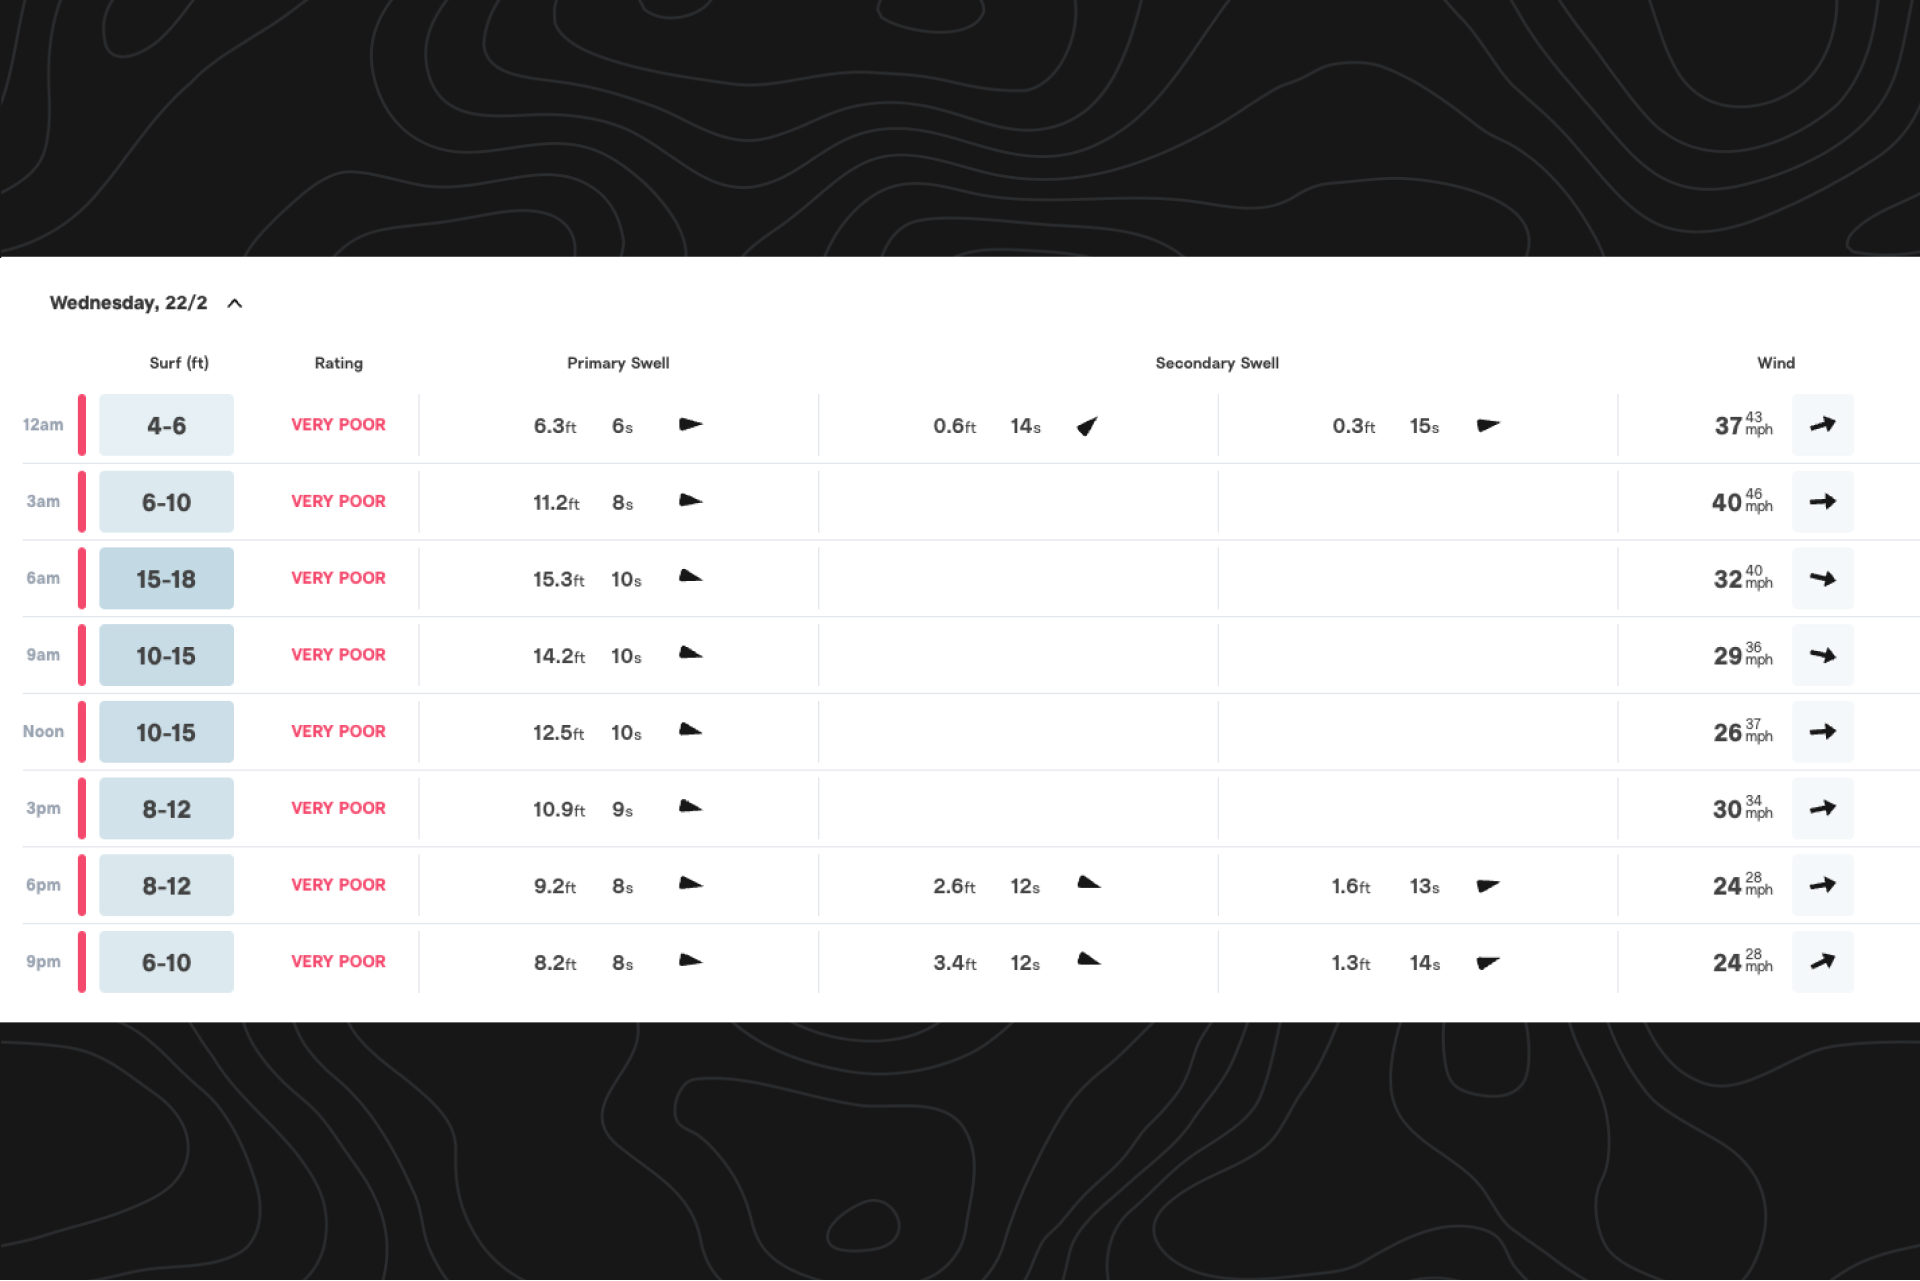
Some of the largest recently reported wave heights at Del Mar were in February 2023, so again, we’ll want to confirm what the model suggested:
But what heights matter most? Because 88% of reported wave heights are less than 4ft., we’ll want to be sure our model is predicting conditions accurately in that surf height range. But we also want to confirm that the rarer 4ft. plus “fair-to-good” days, like the end of January 2023, are also correctly captured by the model:
Our data science team then works with the forecasters to collect information on any particular spot nuances in preparation for model adjustments.
Step 2: analyze data
Looking at the specific dates identified above for Del Mar, how did we do?
- Jan 17th, 2021: We modelled 3-4ft+, a 2ft under call compared with the 4-6ft report.
- Jan 26th, 2023: Similar to the Jan 17th, we modelled 3-4ft+, a 2ft under call compared with the 4-6ft report
- Feb 22nd, 2023: We modelled 10-15ft, compared with a 10-15ft report. We know the the spot settings can handle this swell.
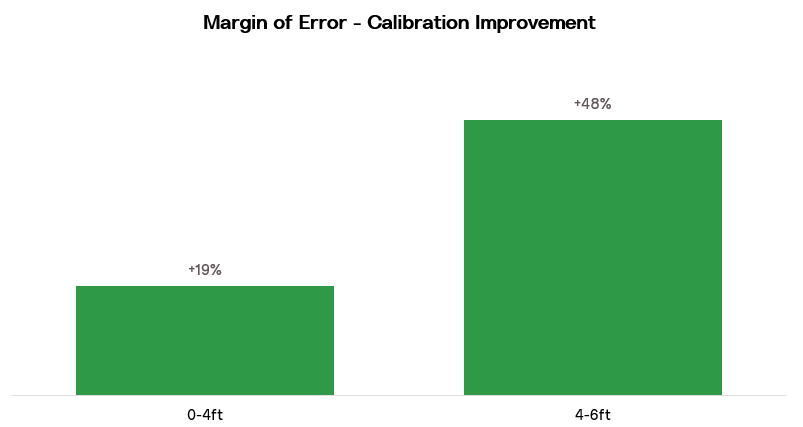
In the 0 - 4ft reported surf height range, we were accurate to within 1.5ft approximately 83% of the time—similar to what you’d expect from your local weather report. In the 4-6ft surf height range, we were accurate to within 1.5ft approximately 62% of the time. Clearly room for improvement here.
Given all these observations, where is the forecast model going wrong? We dive into the model settings and assess the issue, which could be:
- One of our global or nearshore wave models not capturing specific swells.
- The location used to drive the swell data behind the products isn’t in the right place.
- Spot-specific settings that are not configured correctly.
We’ve now identified specific swell events where the model tends to undercall the surf height during north-westerly longer period swells. Essentially, we have learned that the modeled surf heights need to be about two feet larger under this swell period and direction based on systematic tendencies of errors, which means we can start to calibrate, and work toward eliminating (or lessening) these errors moving forward.
Step 3: calibrate
With thousands of observations, like at Del Mar, there is a lot of data to digest. It’d take a human weeks, if not months, to tune all the settings for any given spot. That’s why we implement machine learning algorithms to do this for us, exponentially speeding up the process.
And when observations aren’t readily available? We can ask our forecasters. Everything we do is physics based—we rely on decades of wave science research to implement the most up-to-date and accurate algorithms available.
Now let’s go back to our Del Mar example. How much should we tweak the model? This is where the machine learning algorithm steps forward. Undercalls and overcalls are happening across the whole duration of observations we have for Del Mar. Tweaking for each observation manually would take a long, long time. Our machine learning approach to refining the spot settings allows us tackle all undercalls and overcalls associated to swells important to the spot. We’ll use it on Del Mar and verify the adjustments.
Step 4: verify
Next, we need to verify that the calibration gives us the results we want. Given the input and configurations, does the output match the observations?
We use all the data we’ve gathered and dig into the details to ensure we’re improving the product during the conditions that matter most to the surfers at that spot.
If the verifications don’t meet our expectations, we calibrate again, and again, and again.
After this calibration at Del Mar, we’ve been able to make improvements in the margin of error in both the 4–6ft. surf height range and in the 0–4ft. range. Calibration has also helped maintain the accuracy of surf heights under the conditions of the 10–15ft. event.
Step 5: walk along the coast, monitor changes
We don’t just consider the spot in question when applying the adjustment. We use local expert knowledge, walk along the coast, and align improvements to suitable neighboring surf spots.
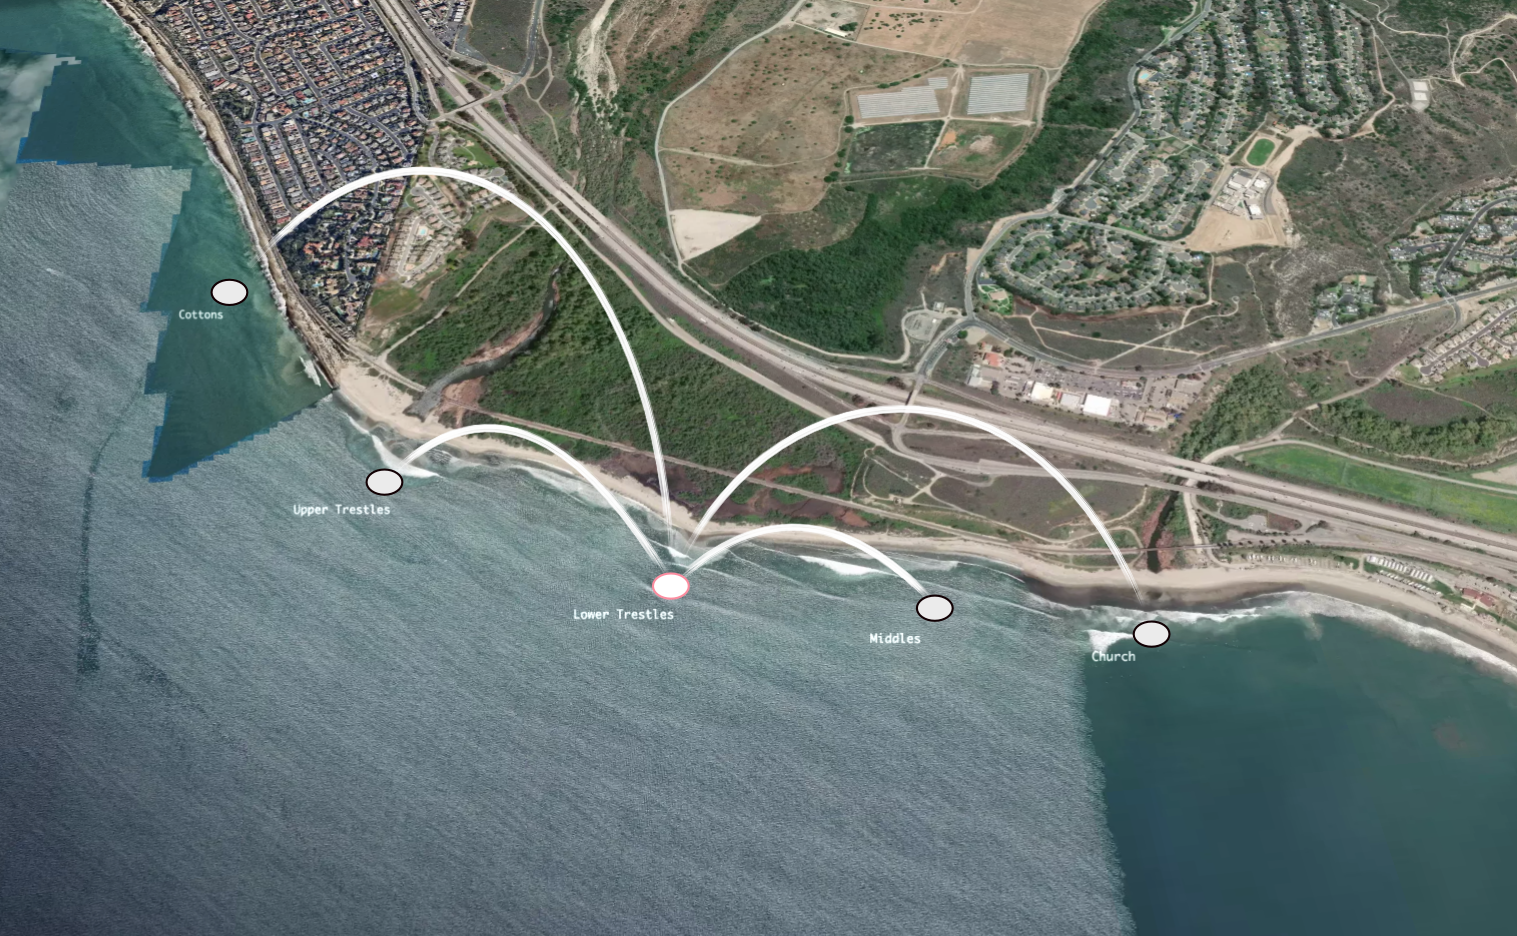
For instance, adjustments applied at Lower Trestles will also likely need to be applied to Uppers, Middles, Church, and Cottons. Or in our Del Mar example, we’d likely want to apply the adjustments to Del Mar Rivermouth and Solana Beach.
But wait, there’s more. We now enter the feedback loop stage. After we’ve applied an adjustment, we continue to monitor and verify the adjustments. We also make sure the current reporters for the spot monitor the model’s accuracy, so they can flag any issues.
After a couple of months, we’ll rerun the verification covering the recent reports and check that the model is performing as expected.
Continuing to improve
Our team is continually applying the methodology applied in the Del Mar example to improve our model configurations at more than 5000 spots around the world. We don’t expect to get the forecast perfectly at every spot for every swell event, but we’re always improving: measuring mean absolute error (MAE) and percentage of occurrence of our model configurations, we see continuous year-over-year improvements across all surf height ranges.
The LOTUS model (and our team) is constantly learning and growing, meaning that the forecasts you see today are even more precise than those you saw a few weeks ago, and tomorrow’s will be even better.
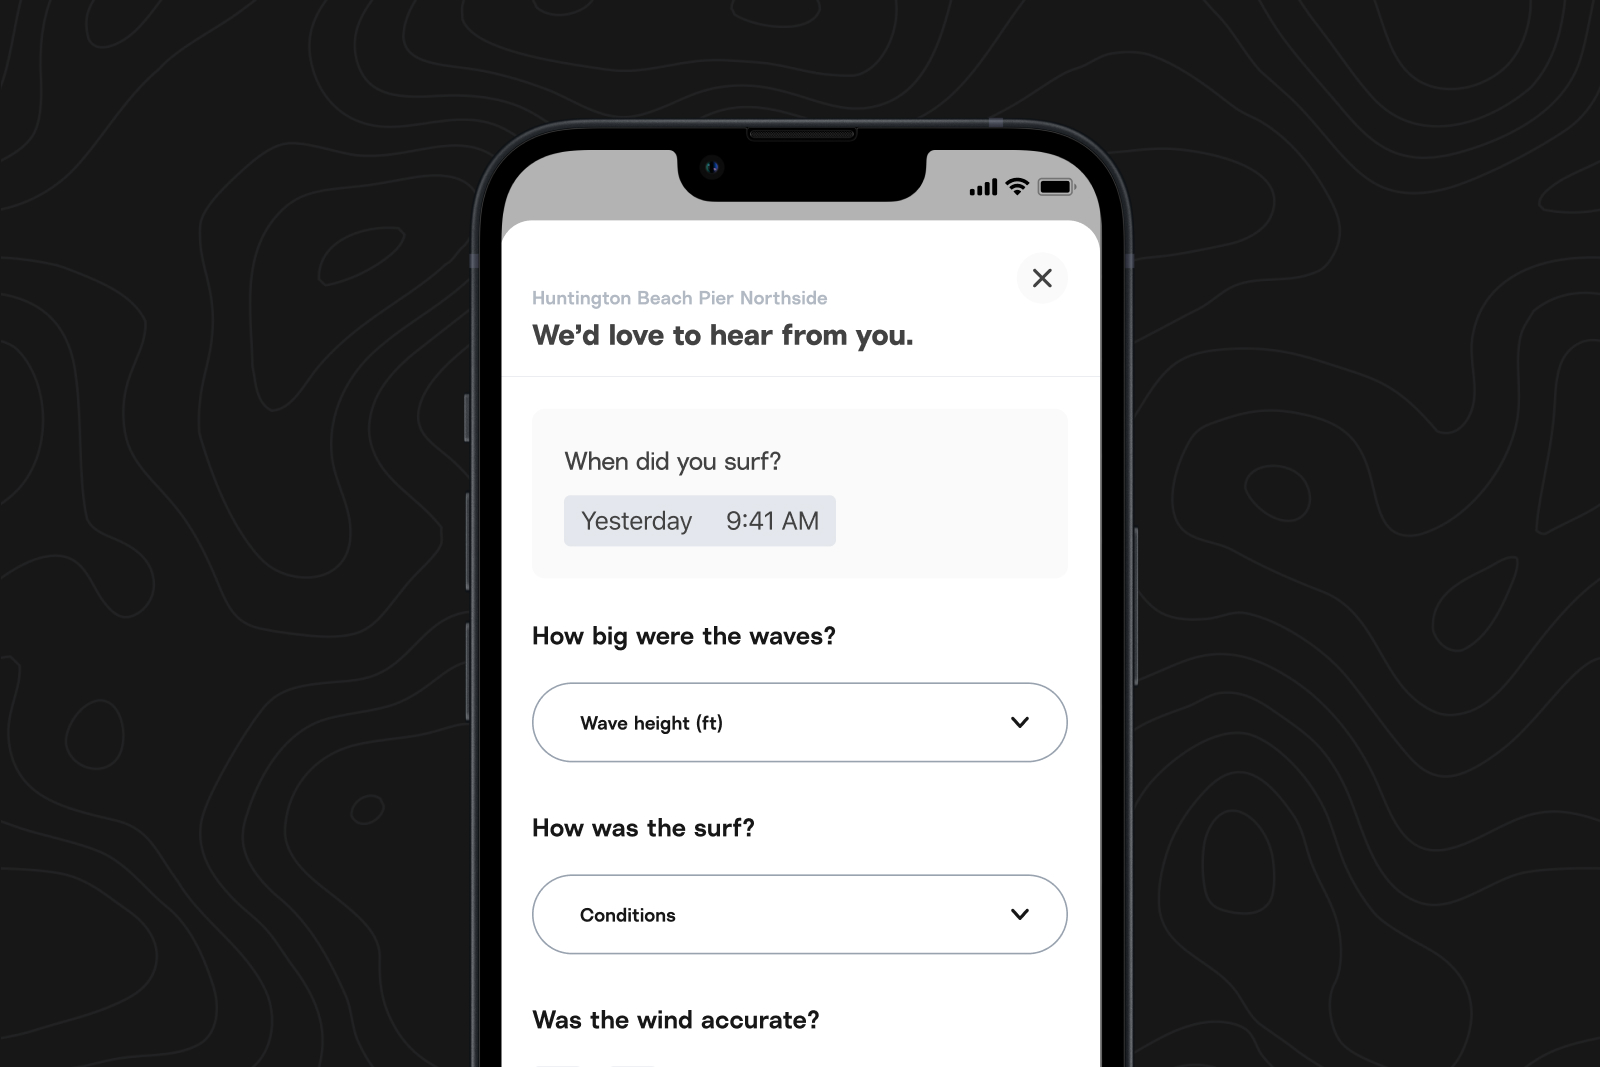
So what’s next? Observation data is crucial to improving our model at spots around the world. We recently launched forecast feedback. Your feedback will help us improve the model for specific spots and overall systemic issues that impact surf height, surf ratings, wave energy, and wave consistency. The more data we get, the more accurate LOTUS and our forecasts will become.
In addition to incorporating more observation data into training our machine learning models, we are planning on:
- Increasing how frequently we observe each spot, using both human and machine learning observations, to better tune the models for different swell conditions at each spot.
- Incorporating new signals—like tide, wind gusts, and beach types—and testing their effects on our ratings models.
Where is LOTUS on Surfline?
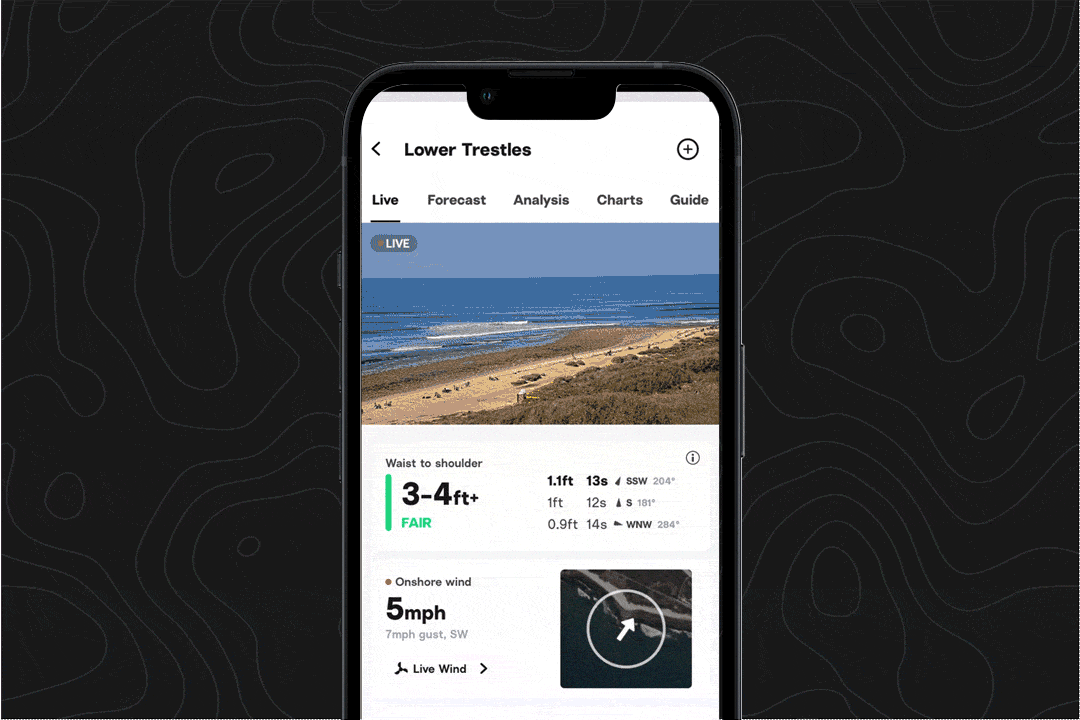
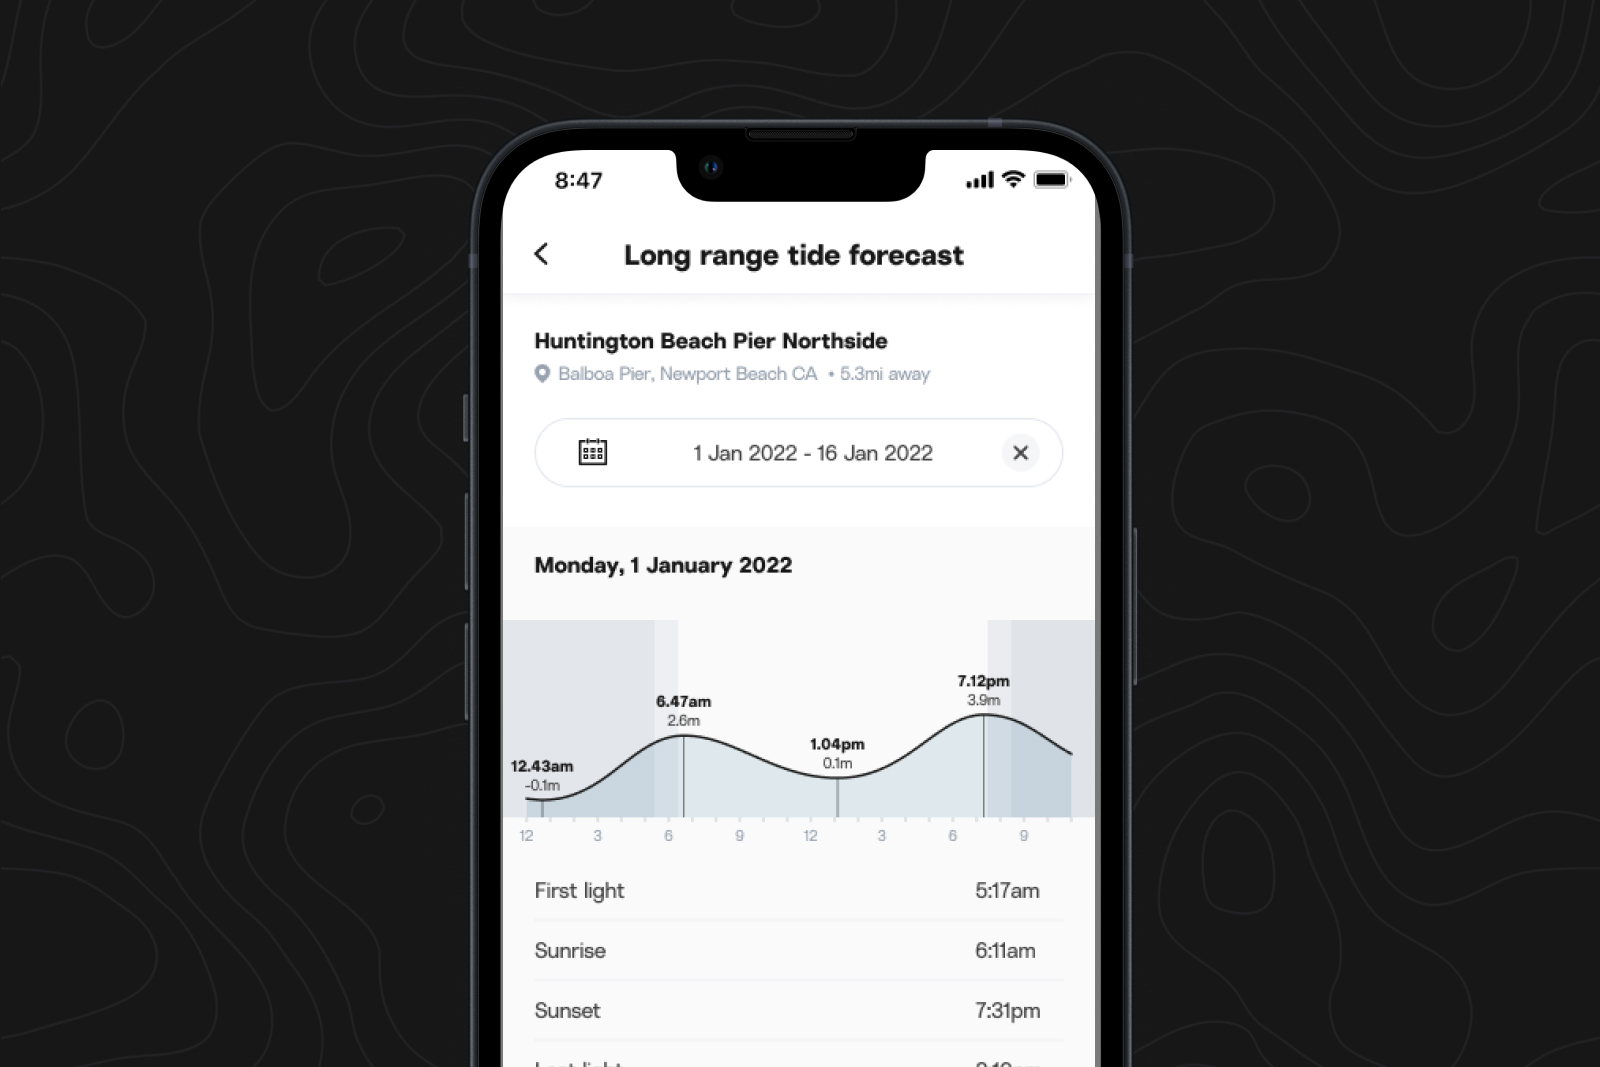
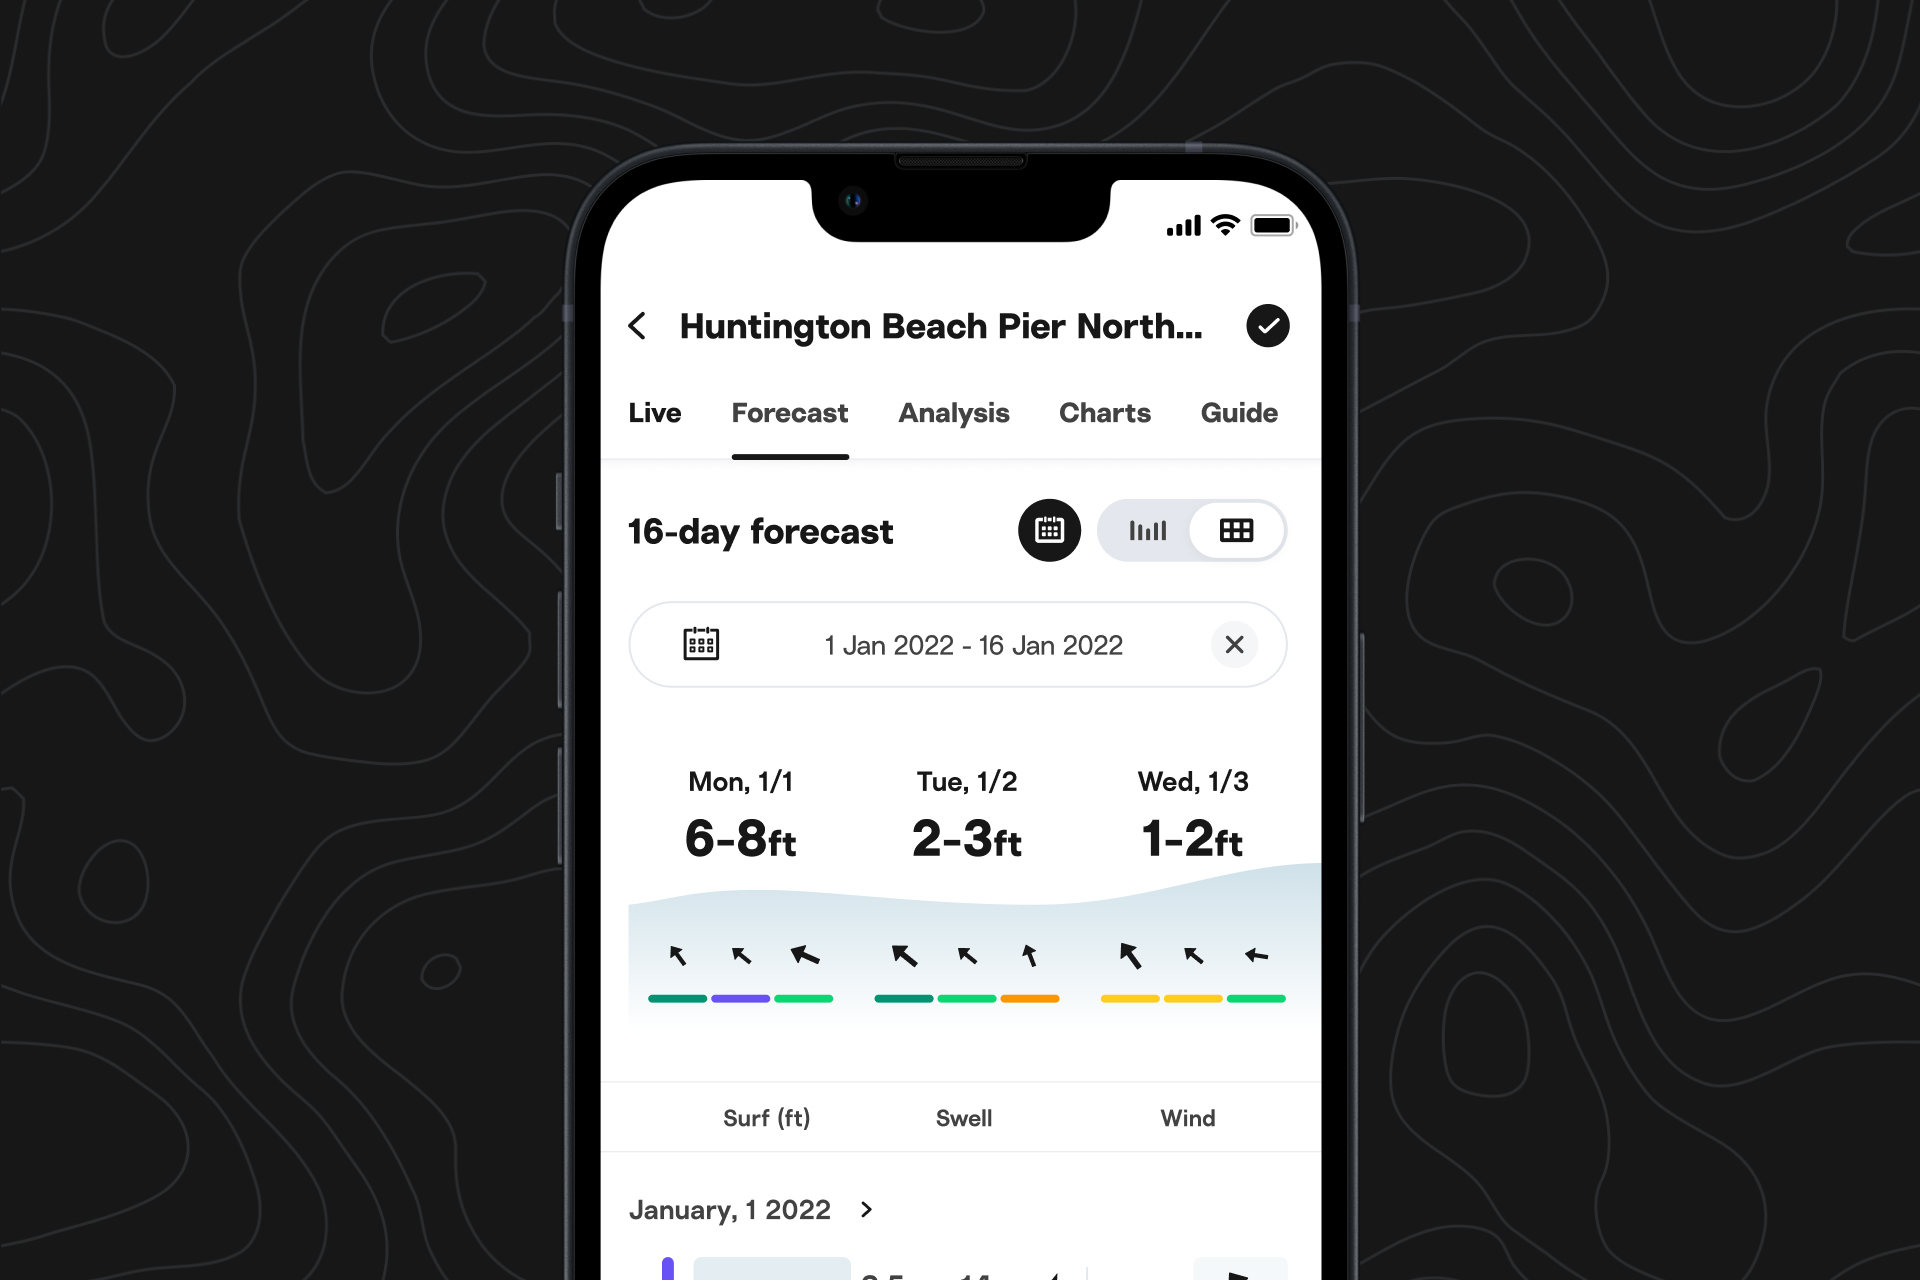
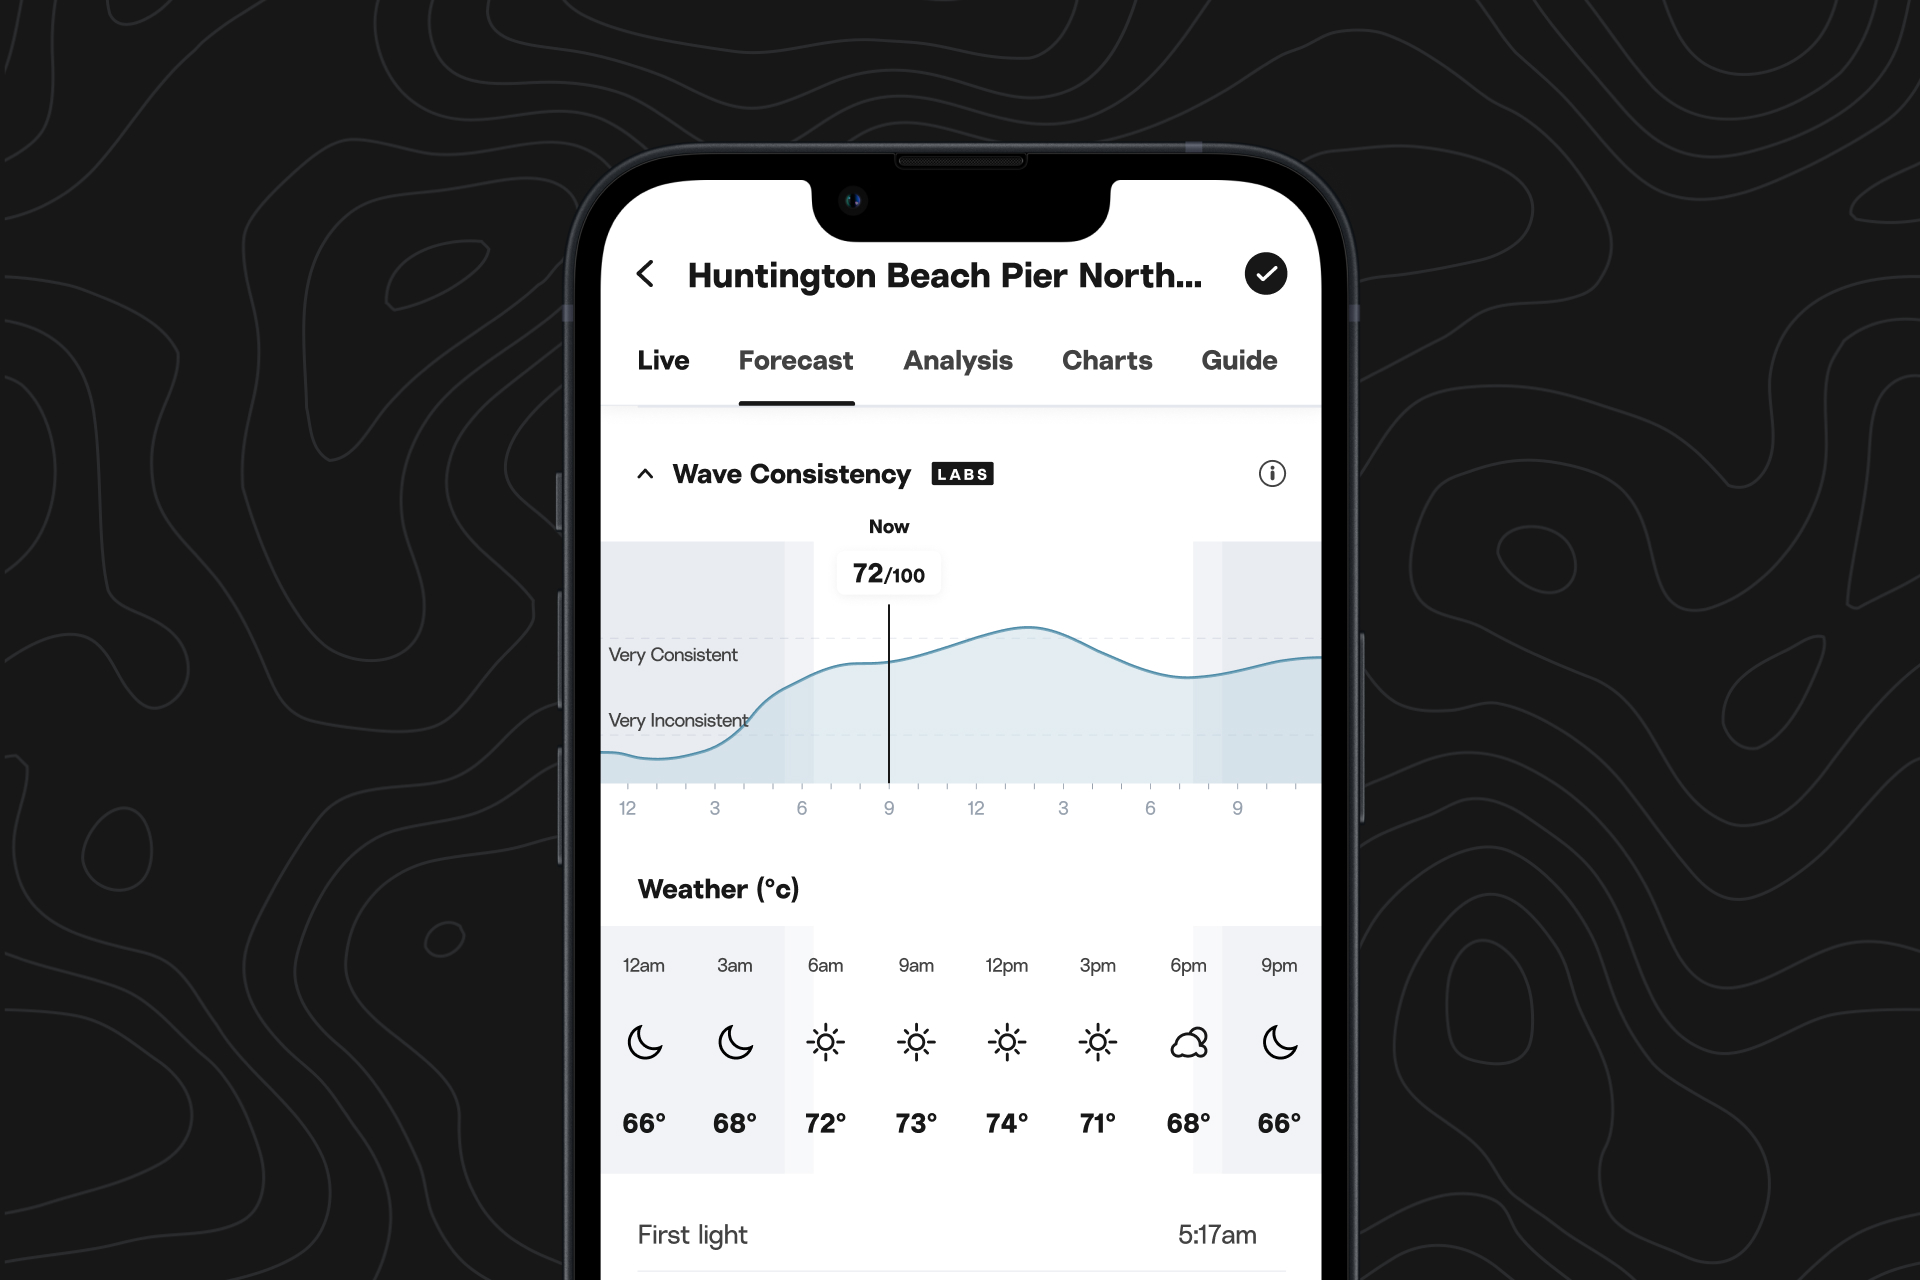
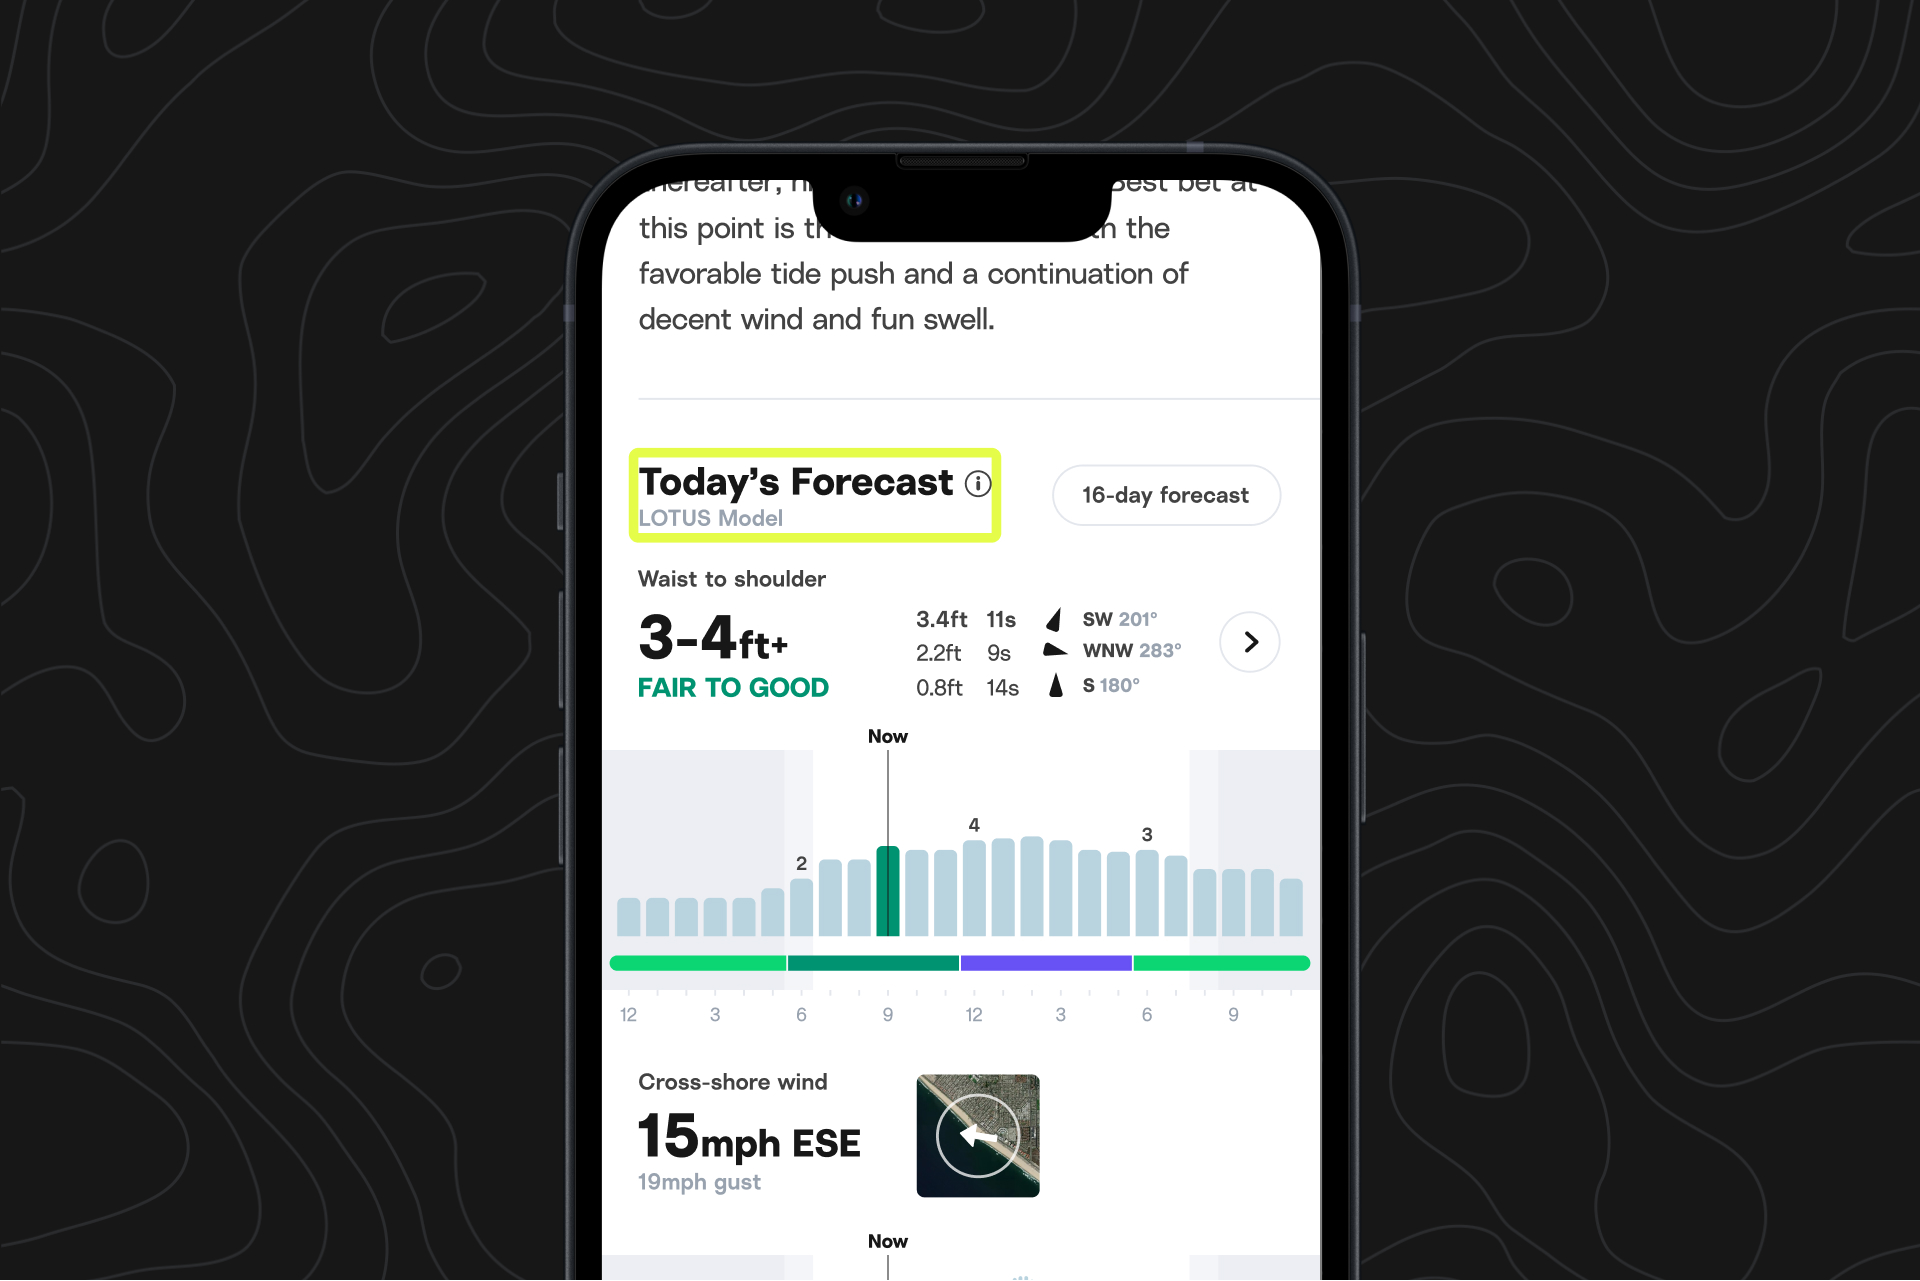
LOTUS data is used to populate various conditions, graphs, and tables at any given spot.
Our in-house team of forecasters supplements and adjusts LOTUS reports with their observations, and as we’ve noted, these observations feed back into LOTUS to improve it.
Note: We recently added some labels to help you differentiate whether the surf report includes forecaster observations, or comes straight from LOTUS. If you see a LOTUS label, you’ll know that the info was generated by our model. If you see a forecaster’s photo, you’ll know that one of our team members has observed the surf and updated the forecast accordingly.